
We may earn a commission if you buy through links on this page. It never changes a score or a ranking. How we make money
The bottom line
Good for polished scientific visuals; check usage rights and seat costs before committing.
BioRender helps researchers create scientific figures, graphs, posters, and presentations with vetted icons, templates, editable AI visuals, and collaboration features. Its free plan is useful for trying the workflow, but it caps users at three figures and excludes publication and commercial use.
For academic teams, a five-seat Academic Lab plan costs $99 per month on annual billing or $129 month to month. That can be a reasonable deal for a full lab group, but a small team should compare it with individual seats and account for graphing or AI add-ons.
Good fit if
- Researchers making scientific figures
- Academic labs sharing visual work
- Teams needing editable scientific icons
Skip it if
- Teams needing free publication rights
- Commercial teams on a tight budget
- People seeking a Prism replacement
ScoresHow it rates
What works
- Scientifically vetted icon library
- Editable AI-generated visuals
- Templates for figures and other visuals
- Imports Prism, CSV, and Excel files for graphing
- Academic Lab includes five seats
What doesn't
- Free plan caps users at three figures
- Free plan excludes publication and commercial use
- Academic Individual costs $35 monthly equivalent annually
- Graphing and AI tools can add monthly costs
- Industry Enterprise pricing is custom
01Who BioRender is for
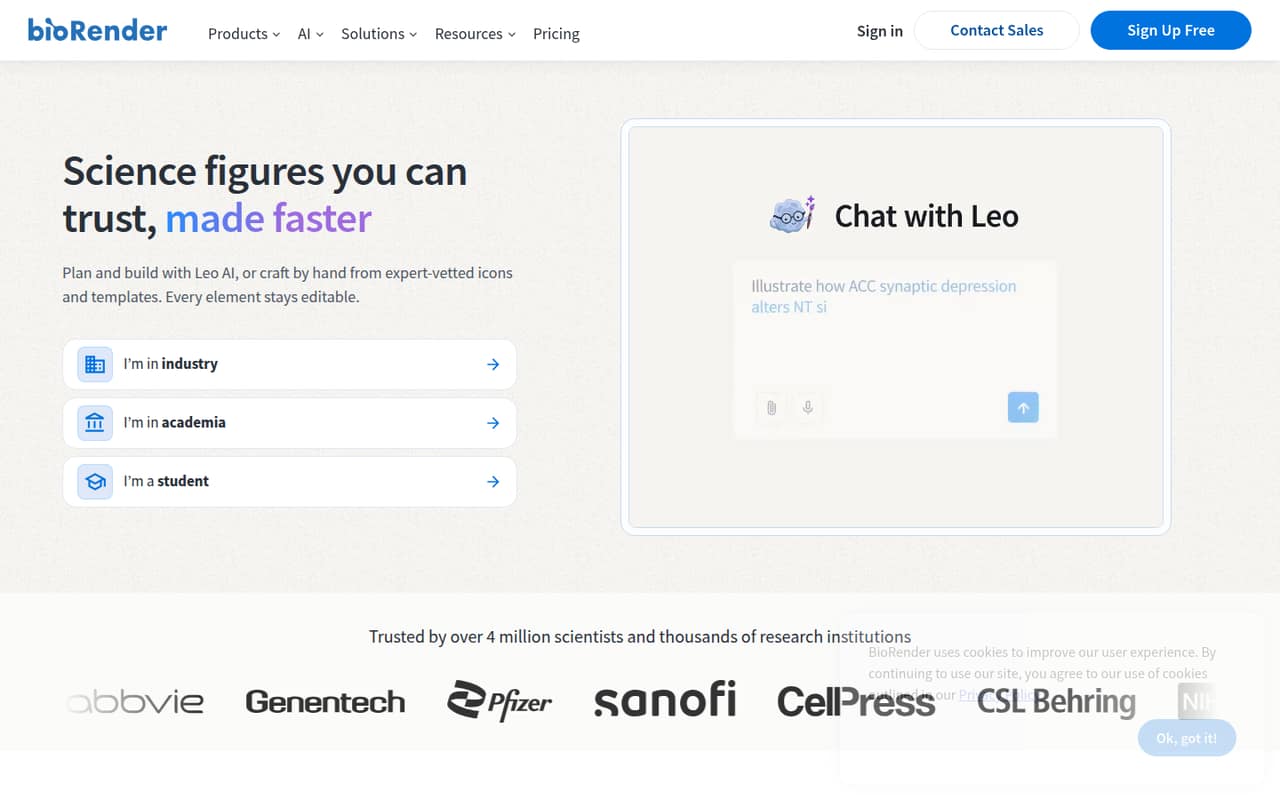
BioRender is for researchers who need to turn scientific ideas into figures, graphs, posters, or presentations without drawing every element from scratch. Its library of scientifically vetted icons and templates is aimed at scientific visuals, while editable AI figures and Leo’s layout help can speed up assembling a draft.
For a solo academic, Academic Individual is the straightforward paid option. A small lab of three to five people should compare separate seats with Academic Lab, which includes five seats for its listed price. The tool also supports teams that need a shared workspace to organize, edit, and review figures. It is less attractive if the main need is general-purpose diagrams, free publication rights, or statistical analysis: the feature list covers graphing and importing data, but does not list statistical analysis as a capability. Commercial teams need commercial usage rights, which start with Industry Individual or a custom Industry Enterprise plan.
02BioRender free plan and trial
The Free plan includes up to three figures, one graphing file, and free AI-tool credits. The number of AI credits is not published in the plan details. The main catch for a working lab is usage: the Free plan does not allow publication or commercial use, so it is for exploring and designing rather than publishing finished work.
BioRender also lists a 14-day free trial. The plan details do not say which paid features or usage rights the trial includes, so confirm those terms before using trial work in a publication or presentation. For ongoing academic publishing, Academic Individual starts at $35 per user per month with annual billing, or $39 month to month.
03What a small team pays for BioRender
For academic users, Academic Individual is $35 per user per month with annual billing ($420 per user for a year) or $39 month to month. Three people pay $105 per month on annual billing, or $117 month to month. Five individual seats cost $175 per month on annual billing, or $195 month to month.
Academic Lab lists five seats for $99 per month with annual billing ($1,188 for a year), or $129 month to month. That makes the lab plan cheaper than five individual seats, but it bundles five seats even if a smaller team will not use them. The plan supports up to 19 users; additional seats cost $20 per month each. Annual prices are monthly equivalents, and monthly billing requires a credit card.
Graphing is an add-on: Academic BioRender Graphing is $15 per seat per month, billed annually. Academic AI-assisted figure generation starts at $4 per month. Commercial users pay $95 per month per Industry Individual seat with annual billing, or $115 month to month; industry add-ons cost more.
04Getting started with BioRender
The listed workflow is visual: start with a customizable template or scientific icons, arrange the figure, and edit text, images, lines, arrows, and shapes. Leo can help plan layouts and build figures, while the graphing feature imports Prism, CSV, or Excel files. That gives a researcher a few ways to start without rebuilding every visual from scratch.
The feature information does not publish a setup time or a formal learning curve, so teams should allow time to learn the editor and agree on how to organize shared work. Academic Lab includes team collaboration and shared folders; the feature list does not specify those inclusions for Free or Academic Individual. For day one, the stated file imports cover common graph data sources, but other integrations are not listed. A team that needs a particular connection should ask BioRender before buying.
05When small teams outgrow BioRender
The first pressure point is usage rights: Free stops working for publication or commercial use, which means researchers may need a paid plan before sharing a finished figure publicly. The next is seats. Academic Lab includes five, supports up to 19 users, and charges $20 per month for each additional seat. Institutions with 20 or more users move to custom Academic Institution pricing; commercial teams need custom Industry Enterprise pricing for team features such as real-time co-editing and SSO.
Add-ons can also push the bill up if everyone needs graphing or AI generation. Reddit discussions reflect concern about individual subscription costs, and one r/labrats post asks whether BioRender can substitute for GraphPad Prism. The listed feature set includes graphing and data imports, but does not list statistical analysis, so teams relying on those capabilities should check the fit before switching. Some users also question the value of the icon library, while others ask about free options for posters.
From the threadsWhat users say
Reddit discussion shows concern about subscription costs and whether BioRender’s graphing can cover needs beyond making figures. Some users also question the value of the icon library, so sentiment is mixed and price-sensitive.
our lab’s individual subscription is up for renewal and the PI is complaining about the cost again
Biorender is just an overpriced ClipArt collection
I had no idea it had statistical analysis and graphing capabilities, since everyone uses it to make figures
I know that there's a free trial for biorender but it can't be used for things like conference posters etc
Questions people ask
What does BioRender software do?
BioRender is a tool for creating scientific figures, graphs, posters, and presentations. Users can work with vetted scientific icons and templates, build editable visuals with AI assistance, and collaborate in a shared workspace. Its graphing feature imports Prism, CSV, or Excel files.
Is BioRender free for students?
BioRender has a Free plan with up to three figures, one graphing file, and free AI-tool credits. It excludes publication and commercial use. Student eligibility for academic pricing is not specified in the plan details, so students should confirm qualification with BioRender.
Can I publish figures made with BioRender?
The Free plan does not include publication rights. Academic Individual and Academic Lab list academic publishing rights, while Industry Individual and Industry Enterprise list commercial usage rights. Check the relevant plan terms before using a figure in a publication or commercial material.
Can BioRender replace GraphPad Prism?
BioRender lists graphing features and imports for Prism, CSV, and Excel files. Its listed features do not specify statistical analysis, so teams that rely on Prism for analysis should confirm BioRender’s capabilities before switching.
How do I cite a BioRender image?
BioRender’s plan details here do not specify citation wording or a citation workflow. Check BioRender’s current usage guidance for the required credit line, and follow the relevant journal or institution rules before submitting a figure.