
We may earn a commission if you buy through links on this page. It never changes a score or a ranking. How we make money
The bottom line
Prometheus keeps software costs at $0, but your team needs the skills to run and query it.
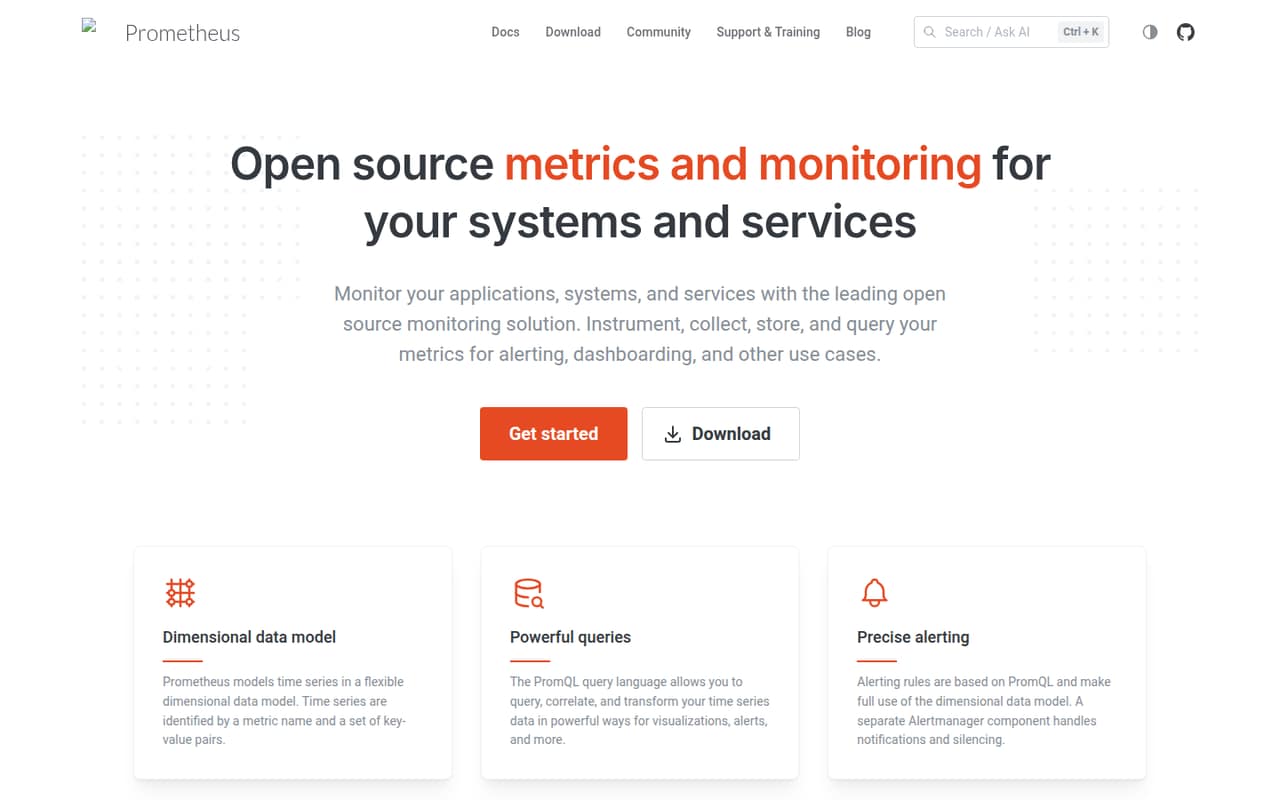
Prometheus is a free, open-source system for collecting, storing and querying metrics, with alerting and dashboarding support. Its dimensional data model and PromQL give technical teams room to build useful monitoring without paying by the seat.
The trade-off is ownership: your team needs to instrument services, learn PromQL and handle the monitoring setup. It’s a practical starting point, but teams with serious performance or scale concerns may need another approach.
Good fit if
- Technical teams on tight budgets
- Teams instrumenting their own services
- Small teams avoiding seat-based fees
Skip it if
- Teams wanting managed monitoring
- Nontechnical teams needing simple setup
- Teams with serious scale concerns
ScoresHow it rates
What works
- Open source and free to use
- No seat or usage limits imposed
- PromQL queries and alerting rules
- Official and community language libraries
- Hundreds of system integrations
What doesn't
- Setup requires technical ownership
- PromQL adds a learning curve
- Servers rely on local storage
- No paid support details are listed
- Teams may outgrow standalone Prometheus
01Who Prometheus is for
Prometheus fits small technical teams that need to monitor applications, systems or services and want to keep software costs down. A team of one to ten can use the Open Source plan without seat limits or usage limits imposed, so there is no per-person bill to watch as the team grows.
In plain terms, Prometheus collects measurements from your systems, stores them as time series and lets your team query them with PromQL. You can use those queries for analysis and alerting, and Prometheus supports dashboarding. Official and community instrumentation libraries cover most major languages, while hundreds of integrations extract metrics from existing systems.
The catch is that free does not mean hands-off. Your team needs to connect metrics sources, work with queries and own the monitoring setup. We’d shortlist it for engineers comfortable with those jobs, not a small business looking for a ready-made monitoring service with minimal setup.
02Prometheus free plan and trial
The Open Source plan costs $0 per month and is listed as free software under the Apache 2.0 license. The pricing page lists no seat limits and no usage limits imposed. There is no separate trial to wait for: the free plan is the product’s listed option.
That makes the software price easy to budget for, whether one person or a team of five needs access. The limits are practical rather than subscription-based. Prometheus servers rely on local storage, and your team still needs to instrument systems, build useful PromQL queries and operate its monitoring setup. The pricing page does not list a hosted tier, paid support option or add-ons. If you need someone else to run the service or help with setup, ask the vendor or your chosen provider what that would cost.
03What a small team pays for Prometheus
The pricing page lists one plan: Open Source at $0 per month. That works out to $0 for one person, $0 for a team of three and $0 for a team of five in software fees. These are not per-seat calculations; the plan has no seat limits imposed. It also lists no usage limits imposed.
Annual billing is not listed, so there is no published annual price to compare with the monthly figure. The pricing page lists no add-ons. That keeps the listed software price simple, but it is not a quote for every cost of running monitoring. Prometheus servers rely on local storage, and the price list does not include a figure for hosting or operating that setup. Budget those separately if your team needs them, and ask any provider you use for its costs. For a small team with the skills and infrastructure already in place, the listed Prometheus cost stays at $0.
04Getting started with Prometheus
Plan for engineering setup rather than a quick, no-code onboarding. Your team needs to get metrics from its systems and services into Prometheus, then learn enough PromQL to query those time series and create useful alerting rules. Official and community instrumentation libraries cover most major languages, and hundreds of integrations can extract metrics from existing systems, giving teams options for common monitoring needs.
The product’s independent servers rely on local storage, so your team also needs to account for how it will operate that setup. No setup-time estimate is published. A commenter on Reddit described a Prometheus setup as smooth and said it required very little of their team’s time, but that is one team’s experience, not a promise.
For day one, start with the systems you most need to monitor and check whether an integration or instrumentation library covers them. Keep the first PromQL queries and alerts focused; the product’s flexibility still asks your team to make technical choices.
05When small teams outgrow Prometheus
There is no published seat or usage threshold that triggers an upgrade: the Open Source plan lists no limits of either kind, and no higher Prometheus plan is listed. The pressure to move is more likely to come from operating needs. If your team runs into performance concerns, needs a different way to handle metrics at scale or no longer wants to own the monitoring setup, reassess whether standalone Prometheus fits.
Reddit users offer mixed, experience-based advice. One commenter favored staying with Prometheus until there is a specific problem, citing team familiarity and lower maintenance effort. Another said Prometheus eventually stops being enough for metrics at scale, while a separate commenter cautioned it is not meant to scale that far on its own.
That is not a universal tipping point, and the discussions do not establish one. For a small team, keep Prometheus while it meets your needs; investigate other architectures when you can name the performance, scale or maintenance problem you need to solve.
From the threadsWhat users say
The Reddit discussion is mixed but leans favorable for teams without a concrete reason to switch. Commenters praise familiarity and low maintenance, while warning that teams with serious scale or performance needs may hit limits.
The prometheus setup was smooth, and we have pretty much put zero time into it
Until you can answer these questions without having to ask Reddit, don’t give yourself more work and stick to Prometheus
At certain point Prometheus just doesn’t cut it any more
Prom isn't really meant to scale to that scale on it's own
Questions people ask
What is Prometheus used for?
Prometheus collects, stores and queries metrics from applications, systems and services. Teams can use PromQL to examine time-series data and define alerting rules. It also supports dashboarding, and its integrations can extract metrics from existing systems.
Is Prometheus free for a small team?
Yes. The pricing page lists the Open Source plan at $0 per month, under the Apache 2.0 license. It lists no seat limits and no usage limits imposed. Hosting and operating costs are separate from that listed software price.
Does Prometheus charge per user?
The Open Source plan lists no seat limits imposed and costs $0 per month. There is no per-user price in the listed plan, so a team of one or five pays the same $0 software price.
Does Prometheus include alerting?
Yes. Prometheus supports alerting, and its alerting rules use PromQL and the dimensional data model. Teams can define rules around the metrics they collect and query.
Which languages can Prometheus monitor?
Official and community instrumentation libraries cover most major languages, according to the feature list. Prometheus also has hundreds of integrations for extracting metrics from existing systems. Check for a suitable library or integration for the specific services your team wants to monitor.